
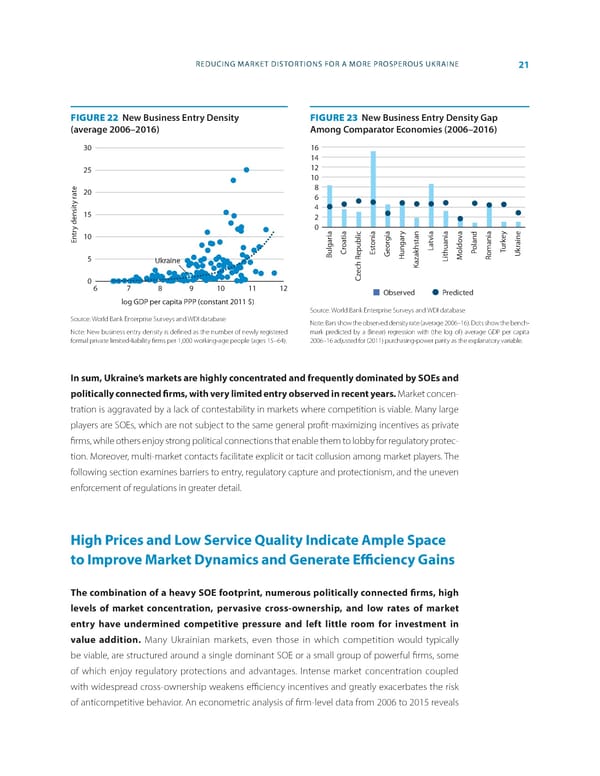
REDUCING MARKET DISTORTIONS FOR A MORE PROSPEROUS UKRAINE 21 FIGURE 22 New Business Entry Density FIGURE 23 New Business Entry Density Gap (average 2006–2016) Among Comparator Economies (2006–2016) 30 16 14 25 12 10 e 8 t 20 a 6 y r 4 15 2 y densit 0 y a tr 10 ia tia ia via v En oa onia g t key aine r eor hstanLa oland ur r BulgarC epublicEstG Hungar oldo P omaniaT Uk 5 Ukraine azak LithuaniaM R ech R K z 0 C 6 7 8 9 10 11 12 Observed Predicted log GDP per capita PPP (constant 2011 $) Source: World Bank Enterprise Surveys and WDI database Source: World Bank Enterprise Surveys and WDI database Note: Bars show the observed density rate (average 2006–16). Dots show the bench- Note: New business entry density is de昀椀ned as the number of newly registered mark predicted by a (linear) regression with (the log of) average GDP per capita formal private limited-liability 昀椀rms per 1,000 working-age people (ages 15–64). 2006–16 adjusted for (2011) purchasing-power parity as the explanatory variable. in sum, Ukraine’s markets are highly concentrated and frequently dominated by SOEs and politically connected 昀椀rms, with very limited entry observed in recent years. Market concen- tration is aggravated by a lack of contestability in markets where competition is viable. Many large players are SOEs, which are not subject to the same general pro昀椀t-maximizing incentives as private 昀椀rms, while others enjoy strong political connections that enable them to lobby for regulatory protec- tion. Moreover, multi-market contacts facilitate explicit or tacit collusion among market players. The following section examines barriers to entry, regulatory capture and protectionism, and the uneven enforcement of regulations in greater detail. High Prices and Low Service Quality indicate Ample Space to improve Market Dynamics and Generate E昀케ciency Gains The combination of a heavy SOE footprint, numerous politically connected 昀椀rms, high levels of market concentration, pervasive cross-ownership, and low rates of market entry have undermined competitive pressure and left little room for investment in value addition. Many Ukrainian markets, even those in which competition would typi cally be viable, are structured around a single dominant SOE or a small group of powerful 昀椀rms, some of which enjoy regulatory protections and advantages. Intense market concentration coupled with widespread cross-ownership weakens e昀케ciency incentives and greatly exacerbates the risk of anticompetitive behavior. An econometric analysis of 昀椀rm-level data from 2006 to 2015 reveals
 World Bank Document Page 28 Page 30