
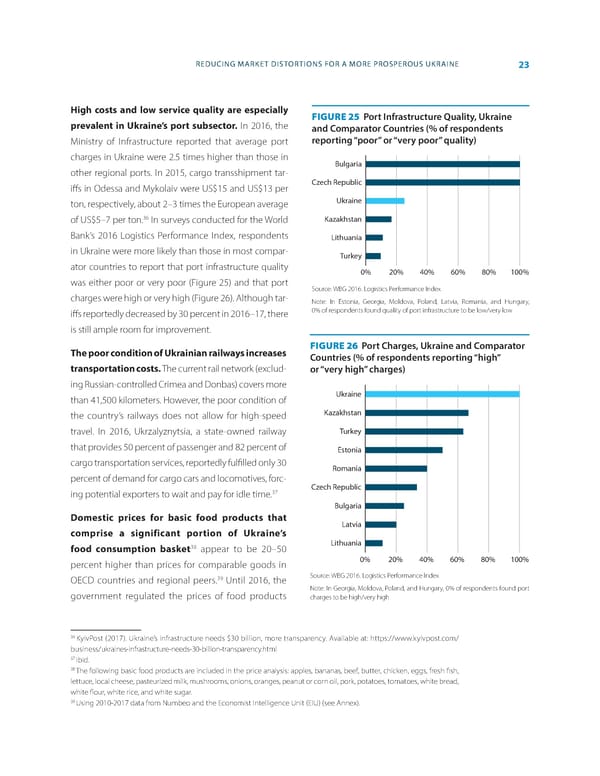
REDUCING MARKET DISTORTIONS FOR A MORE PROSPEROUS UKRAINE 23 High costs and low service quality are especially FIGURE 25 Port Infrastructure Quality, Ukraine prevalent in Ukraine’s port sub sector. In 2016, the and Comparator Countries (% of respondents Ministry of Infrastructure reported that average port reporting “poor” or “very poor” quality) charges in Ukraine were 2.5 times higher than those in Bulgaria other regional ports. In 2015, cargo transshipment tar- i昀昀s in Odessa and Mykolaiv were US$15 and US$13 per Czech Republic ton, respectively, about 2–3 times the European average Ukraine of US$5–7 per ton.36 In surveys conducted for the World Kazakhstan Bank’s 2016 Logistics Performance Index, respondents Lithuania in Ukraine were more likely than those in most compar- Turkey ator countries to report that port infrastructure quality 0% 20% 40% 60% 80% 100% was either poor or very poor (Figure 25) and that port Source: WBG 2016. Logistics Performance Index charges were high or very high (Figure 26). Although tar- Note: In Estonia, Georgia, Moldova, Poland, Latvia, Romania, and Hungary, i昀昀s reportedly decreased by 30 percent in 2016–17, there 0% of respondents found quality of port infrastructure to be low/very low is still ample room for improvement. The poor condition of Ukrainian railways increases FIGURE 26 Port Charges, Ukraine and Comparator Countries (% of respondents reporting “high” transportation costs. The current rail network (exclud- or “very high” charges) ing Russian-controlled Crimea and Donbas) covers more than 41,500 kilometers. However, the poor condition of Ukraine the country’s railways does not allow for high-speed Kazakhstan travel. In 2016, Ukrzalyznytsia, a state-owned railway Turkey that provides 50 percent of passenger and 82 percent of Estonia cargo transportation services, reportedly ful昀椀lled only 30 Romania percent of demand for cargo cars and locomotives, forc- ing potential exporters to wait and pay for idle time.37 Czech Republic Bulgaria Domestic prices for basic food products that Latvia comprise a significant portion of Ukraine’s 38 Lithuania food consumption basket appear to be 20–50 percent higher than prices for comparable goods in 0% 20% 40% 60% 80% 100% 39 Source: WBG 2016. Logistics Performance Index OECD countries and regional peers. Until 2016, the government regulated the prices of food products Note: In Georgia, Moldova, Poland, and Hungary, 0% of respondents found port charges to be high/very high 36 KyivPost (2017). Ukraine’s infrastructure needs $30 billion, more transparency. Available at: https://www.kyivpost.com/ business/ukraines-infrastructure-needs-30-billion-transparency.html 37 Ibid. 38 The following basic food products are included in the price analysis: apples, bananas, beef, butter, chicken, eggs, fresh 昀椀sh, lettuce, local cheese, pasteurized milk, mushrooms, onions, oranges, peanut or corn oil, pork, potatoes, tomatoes, white bread, white 昀氀our, white rice, and white sugar. 39 Using 2010-2017 data from Numbeo and the Economist Intelligence Unit (EIU) (see Annex).
 World Bank Document Page 30 Page 32