
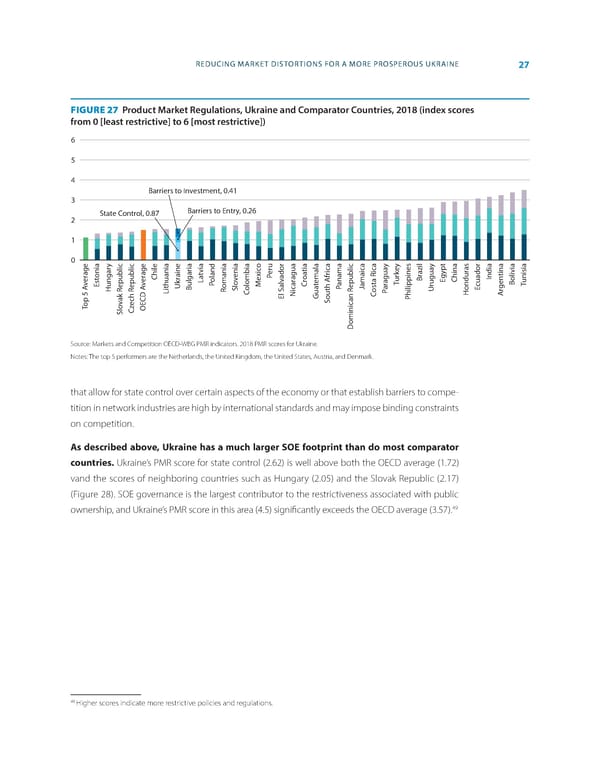
REDUCING MARKET DISTORTIONS FOR A MORE PROSPEROUS UKRAINE 27 FIGURE 27 Product Market Regulations, Ukraine and Comparator Countries, 2018 (index scores from 0 [least restrictive] to 6 [most restrictive]) 6 5 4 Barriers to Investment, 0.41 3 State Control, 0.87 Barriers to Entry, 0.26 2 1 0 y ia o y y as via eru tia ica ica key azil ageonia age aine t enia xicP adoraguaoa fr gypt ndiatina er er Chile r La oland v e r emala aguaur Br E China I oliviaunisia v Est epublicepublicvUk P omania M alv C t anamaepublicJamaicaT cuadorgenB T Hungar Bulgar R Slo olombia icar P osta Rar Urugua E r Lithuania C El SN Guaouth A C P hilippines Hondur A ak R S P op 5 A v ech R T z OECD A SloC ominican R D Source: Markets and Competition OECD-WBG PMR indicators. 2018 PMR scores for Ukraine. Notes: The top 5 performers are the Netherlands, the United Kingdom, the United States, Austria, and Denmark. that allow for state control over certain aspects of the economy or that establish barriers to compe- tition in network industries are high by international standards and may impose binding constraints on competition. As described above, Ukraine has a much larger SOE footprint than do most comparator countries. Ukraine’s PMR score for state control (2.62) is well above both the OECD average (1.72) vand the scores of neighboring countries such as Hungary (2.05) and the Slovak Republic (2.17) (Figure 28). SOE governance is the largest contributor to the restrictiveness associated with public ownership, and Ukraine’s PMR score in this area (4.5) signi昀椀cantly exceeds the OECD average (3.57).49 49 Higher scores indicate more restrictive policies and regulations.
 World Bank Document Page 34 Page 36