
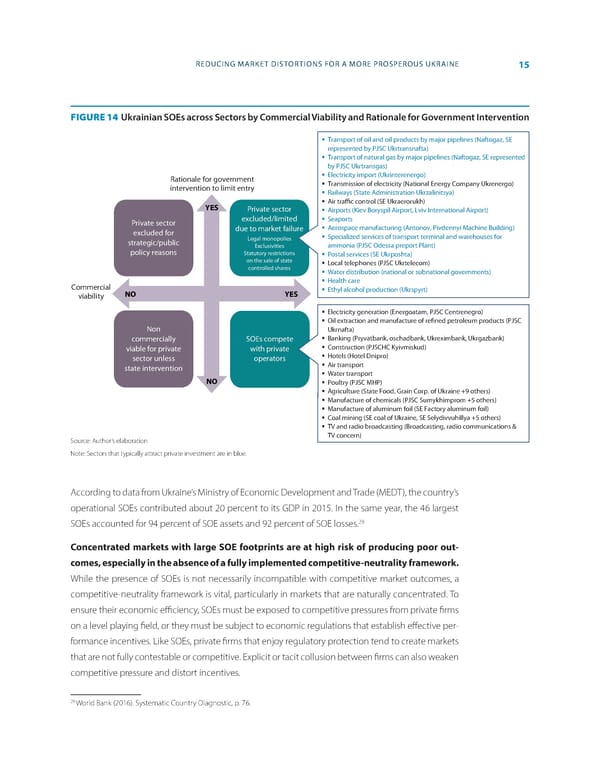
REDUCING MARKET DISTORTIONS FOR A MORE PROSPEROUS UKRAINE 15 FIGURE 14 Ukrainian SOEs across Sectors by Commercial Viability and Rationale for Government Intervention Transport of oil and oil products by major pipelines (Naftogaz, SE represented by PJSC Ukrtransnafta) Transport of natural gas by major pipelines (Naftogaz, SE represented by PJSC Ukrtransgas) Rationale for government Electricity import (Ukrinterenergo) intervention to limit entry Transmission of electricity (National Energy Company Ukrenergo) Railways (State Administration Ukrzalinitsya) YES Air tra c control (SE Ukraerorukh) Private sector Airports (Kiev Boryspil Airport, Lviv International Airport) Private sector excluded/limited Seaports excluded for due to market failure Aerospace manufacturing (Antonov, Pivdennyi Machine Building) strategic/public Legal monopolies Specialized services of transport terminal and warehouses for Exclusivities ammonia (PJSC Odessa preport Plant) policy reasons Statutory restrictions Postal services (SE Ukrposhta) on the sale of state Local telephones (PJSC Ukrtelecom) controlled shares Water distribution (national or subnational governments) Commercial Health care viability NO YES Ethyl alcohol production (Ukrspyrt) Electricity generation (Energoatam, PJSC Centrenegro) Oil extraction and manufacture of re ned petroleum products (PJSC Non Ukrnafta) commercially SOEs compete Banking (Pryvatbank, oschadbank, Ukreximbank, Ukrgazbank) viable for private with private Construction (PJSCHC Kyivmiskud) sector unless operators Hotels (Hotel Dnipro) state intervention Air transport Water transport NO Poultry (PJSC MHP) Agriculture (State Food, Grain Corp. of Ukraine +9 others) Manufacture of chemicals (PJSC Sumykhimprom +5 others) Manufacture of aluminum foil (SE Factory aluminum foil) Coal mining (SE coal of Ukraine, SE Selydivvuhillya +5 others) TV and radio broadcasting (Broadcasting, radio communications & Source: Author’s elaboration TV concern) Note: Sectors that typically attract private investment are in blue. According to data from Ukraine’s Ministry of Economic Development and Trade (MEDT), the country’s operational SOEs contributed about 20 percent to its GDP in 2015. In the same year, the 46 largest 29 SOEs accounted for 94 percent of SOE assets and 92 percent of SOE losses. Concentrated markets with large SOE footprints are at high risk of producing poor out- comes, especially in the absence of a fully implemented competitive-neutrality framework. While the presence of SOEs is not necessarily incompatible with competitive market outcomes, a competitive-neutrality framework is vital, particularly in markets that are naturally concentrated. To ensure their economic e昀케ciency, SOEs must be exposed to competitive pressures from private 昀椀rms on a level playing 昀椀eld, or they must be subject to economic regulations that establish e昀昀ective per- formance incentives. Like SOEs, private 昀椀rms that enjoy regulatory protection tend to create markets that are not fully contestable or competitive. Explicit or tacit collusion between 昀椀rms can also weaken competitive pressure and distort incentives. 29 World Bank (2016). Systematic Country Diagnostic, p. 76.
 World Bank Document Page 22 Page 24