
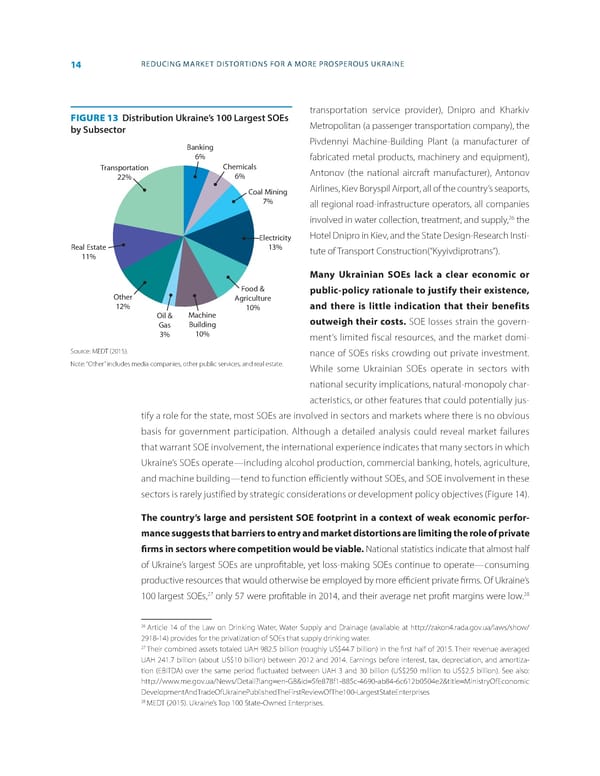
14 REDUCING MARKET DISTORTIONS FOR A MORE PROSPEROUS UKRAINE FIGURE 13 Distribution Ukraine’s 100 Largest SOEs transportation service provider), Dnipro and Kharkiv by Subsector Metropolitan (a passenger transportation company), the Banking Pivdennyi Machine-Building Plant (a manufacturer of 6% fabricated metal products, machinery and equipment), Transportation Chemicals Antonov (the national aircraft manufacturer), Antonov 22% 6% Coal Mining Airlines, Kiev Boryspil Airport, all of the country’s seaports, 7% all regional road-infrastructure operators, all companies 26 involved in water collection, treatment, and supply, the Electricity Hotel Dnipro in Kiev, and the State Design-Research Insti- Real Estate 13% tute of Transport Construction(“Kyyivdiprotrans”). 11% Many Ukrainian SOEs lack a clear economic or Food & public-policy rationale to justify their existence, Other Agriculture 12% 10% and there is little indication that their benefits Oil & Machine outweigh their costs. SOE losses strain the govern- Gas Building 3% 10% ment’s limited fiscal resources, and the market domi- Source: MEDT (2015). nance of SOEs risks crowding out private investment. Note: “Other” includes media companies, other public services, and real estate. While some Ukrainian SOEs operate in sectors with national security implications, natural-monopoly char- acteristics, or other features that could potentially jus- tify a role for the state, most SOEs are involved in sectors and markets where there is no obvious basis for government participation. Although a detailed analysis could reveal market failures that warrant SOE involvement, the international experience indicates that many sectors in which Ukraine’s SOEs operate—including alcohol production, commercial banking, hotels, agriculture, and machine building—tend to function efficiently without SOEs, and SOE involvement in these sectors is rarely justified by strategic considerations or development policy objectives (Figure 14). The country’s large and persistent SOE footprint in a context of weak economic perfor- mance suggests that barriers to entry and market distortions are limiting the role of private 昀椀rms in sectors where competition would be viable. National statistics indicate that almost half of Ukraine’s largest SOEs are unpro昀椀table, yet loss-making SOEs continue to operate—consuming productive resources that would otherwise be employed by more e昀케cient private 昀椀rms. Of Ukraine’s 27 28 100 largest SOEs, only 57 were pro昀椀table in 2014, and their average net pro昀椀t margins were low. 26 Article 14 of the Law on Drinking Water, Water Supply and Drainage (available at http://zakon4.rada.gov.ua/laws/show/ 2918-14) provides for the privatization of SOEs that supply drinking water. 27 Their combined assets totaled UAH 982.5 billion (roughly US$44.7 billion) in the 昀椀rst half of 2015. Their revenue averaged UAH 241.7 billion (about US$10 billion) between 2012 and 2014. Earnings before interest, tax, depreciation, and amortiza- tion (EBITDA) over the same period 昀氀uctuated between UAH 3 and 30 billion (US$250 million to US$2.5 billion). See also: http://www.me.gov.ua/News/Detail?lang=en-GB&id=5fe878f1-885c-4690-ab84-6c612b0504e2&title=MinistryOfEconomic DevelopmentAndTradeOfUkrainePublishedTheFirstReviewOfThe100-LargestStateEnterprises 28 MEDT (2015). Ukraine’s Top 100 State-Owned Enterprises.
 World Bank Document Page 21 Page 23