
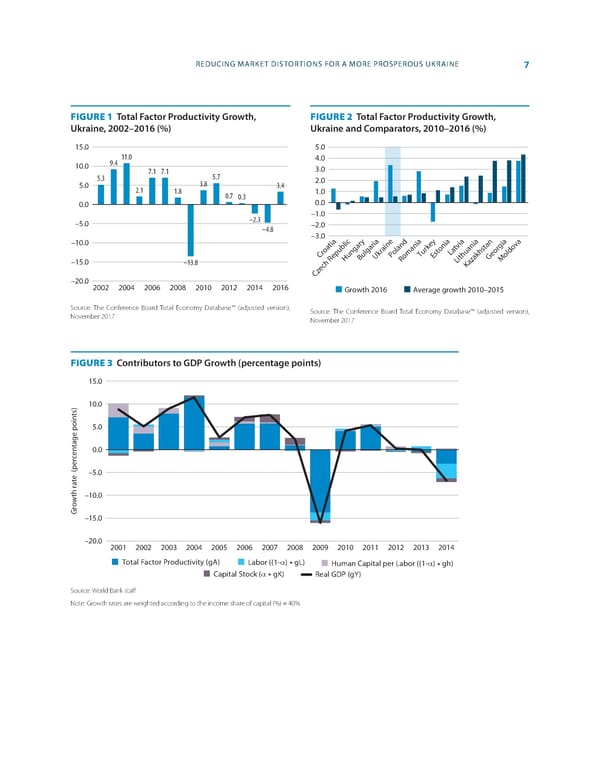
REDUCING MARKET DISTORTIONS FOR A MORE PROSPEROUS UKRAINE 7 FIGURE 1 Total Factor Productivity Growth, FIGURE 2 Total Factor Productivity Growth, Ukraine, 2002–2016 (%) Ukraine and Comparators, 2010–2016 (%) 15.0 5.0 9.4 11.0 4.0 10.0 7.1 7.1 3.0 5.3 5.7 2.0 5.0 2.1 3.8 3.4 1.8 0.7 0.3 1.0 0.0 0.0 –2.3 –1.0 –5.0 –4.8 –2.0 –10.0 –3.0 Croatia Poland Turkey Latvia Ukraine Estonia Georgia Bulgaria –15.0 –13.8 Hungary Romania Lithuania Moldova Kazakhstan –20.0 Czech Republic 2002 2004 2006 2008 2010 2012 2014 2016 Growth 2016 Average growth 2010–2015 Source: The Conference Board Total Economy Database™ (adjusted version), Source: The Conference Board Total Economy Database™ (adjusted version), November 2017 November 2017 FIGURE 3 Contributors to GDP Growth (percentage points) 15.0 10.0 5.0 0.0 –5.0 –10.0 Growth rate (percentage points) –15.0 –20.0 2001 2002 2003 2004 2005 2006 2007 2008 2009 2010 2011 2012 2013 2014 Total Factor Productivity (gA) Labor ((1-α) * gL) Human Capital per Labor ((1-α) * gh) Capital Stock (α * gK) Real GDP (gY) Source: World Bank sta昀昀 Note: Growth rates are weighted according to the income share of capital (%) = 40%
 World Bank Document Page 14 Page 16