
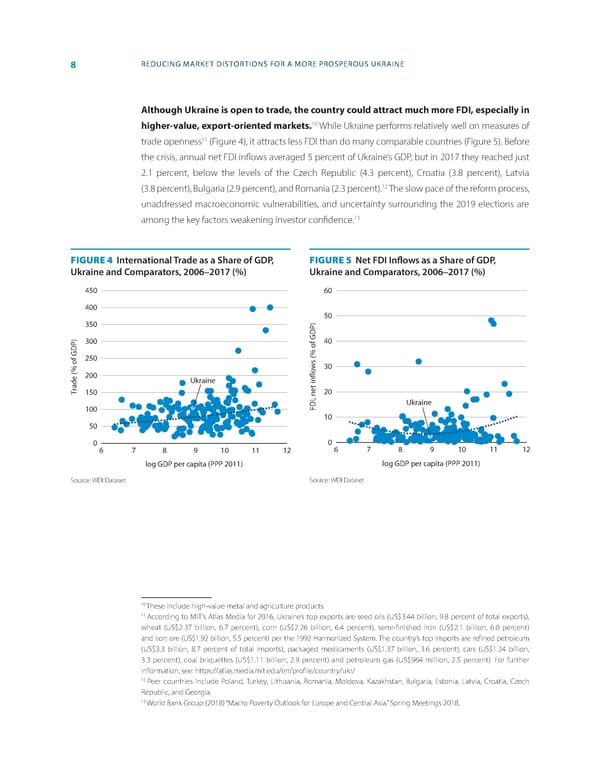
8 REDUCING MARKET DISTORTIONS FOR A MORE PROSPEROUS UKRAINE Although Ukraine is open to trade, the country could attract much more FDi, especially in 10 higher-value, export-oriented markets. While Ukraine performs relatively well on measures of 11 trade openness (Figure 4), it attracts less FDI than do many comparable countries (Figure 5). Before the crisis, annual net FDI in昀氀ows averaged 5 percent of Ukraine’s GDP, but in 2017 they reached just 2.1 percent, below the levels of the Czech Republic (4.3 percent), Croatia (3.8 percent), Latvia 12 (3.8 percent), Bulgaria (2.9 percent), and Romania (2.3 percent). The slow pace of the reform process, unaddressed macroeconomic vulnerabilities, and uncertainty surrounding the 2019 elections are among the key factors weakening investor con昀椀dence.13 FIGURE 4 International Trade as a Share of GDP, FIGURE 5 Net FDI In昀氀ows as a Share of GDP, Ukraine and Comparators, 2006–2017 (%) Ukraine and Comparators, 2006–2017 (%) 450 60 400 ) 50 350 GDP40 300 f o % 250 ( s 30 200 Ukraine in ow t Trade (% of GDP)150 ne 20 , Ukraine DI 100 F 10 50 0 06 7 8 9 10 11 12 6 7 8 9 10 11 12 log GDP per capita (PPP 2011) log GDP per capita (PPP 2011) Source: WDI Dataset Source: WDI Dataset 10 These include high-value metal and agriculture products. 11 According to MIT’s Atlas Media for 2016, Ukraine’s top exports are seed oils (US$3.44 billion, 9.8 percent of total exports), wheat (US$2.37 billion, 6.7 percent), corn (US$2.26 billion, 6.4 percent), semi-昀椀nished iron (US$2.1 billion, 6.0 percent) and iron ore (US$1.92 billion, 5.5 percent) per the 1992 Harmonized System. The country’s top imports are re昀椀ned petroleum (US$3.3 billion, 8.7 percent of total imports), packaged medicaments (US$1.37 billion, 3.6 percent), cars (US$1.24 billion, 3.3 percent), coal briquettes (US$1.11 billion, 2.9 percent) and petroleum gas (US$964 million, 2.5 percent). For further information, see: https://atlas.media.mit.edu/en/pro昀椀le/country/ukr/ 12 Peer countries include Poland, Turkey, Lithuania, Romania, Moldova, Kazakhstan, Bulgaria, Estonia, Latvia, Croatia, Czech Republic, and Georgia. 13 World Bank Group (2018) “Macro Poverty Outlook for Europe and Central Asia.” Spring Meetings 2018.
 World Bank Document Page 15 Page 17