
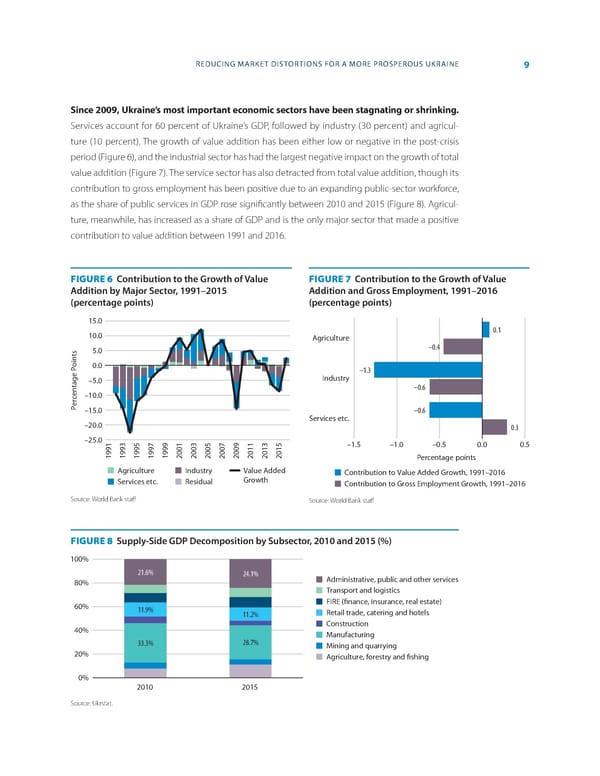
REDUCING MARKET DISTORTIONS FOR A MORE PROSPEROUS UKRAINE 9 Since 2009, Ukraine’s most important economic sectors have been stagnating or shrinking. Services account for 60 percent of Ukraine’s GDP, followed by industry (30 percent) and agricul- ture (10 percent). The growth of value addition has been either low or negative in the post-crisis period (Figure 6), and the industrial sector has had the largest negative impact on the growth of total value addition (Figure 7). The service sector has also detracted from total value addition, though its contribution to gross employment has been positive due to an expanding public-sector workforce, as the share of public services in GDP rose signi昀椀cantly between 2010 and 2015 (Figure 8). Agricul- ture, meanwhile, has increased as a share of GDP and is the only major sector that made a positive contribution to value addition between 1991 and 2016. FIGURE 6 Contribution to the Growth of Value FIGURE 7 Contribution to the Growth of Value Addition by Major Sector, 1991–2015 Addition and Gross Employment, 1991–2016 (percentage points) (percentage points) 15.0 10.0 0.1 Agriculture 5.0 –0.4 0.0 –1.3 –5.0 Industry –0.6 –10.0 Percentage Points–15.0 –0.6 –20.0 Services etc. 0.3 –25.0 1 3 5 7 9 1 3 5 7 9 1 3 5 –1.5 –1.0 –0.5 0.0 0.5 9 9 9 9 9 0 0 0 0 0 1 1 1 9 9 9 9 9 0 0 0 0 0 0 0 0 1 1 1 1 1 2 2 2 2 2 2 2 2 Percentage points Agriculture Industry Value Added Contribution to Value Added Growth, 1991–2016 Services etc. Residual Growth Contribution to Gross Employment Growth, 1991–2016 Source: World Bank sta昀昀 Source: World Bank sta昀昀 FIGURE 8 Supply-Side GDP Decomposition by Subsector, 2010 and 2015 (%) 100% 21.6% 24.1% 80% Administrative, public and other services Transport and logistics 60% FIRE ( nance, insurance, real estate) 11.9% 11.2% Retail trade, catering and hotels 40% Construction Manufacturing 33.3% 28.7% Mining and quarrying 20% Agriculture, forestry and shing 0% 2010 2015 Source: Ukrstat.
 World Bank Document Page 16 Page 18