
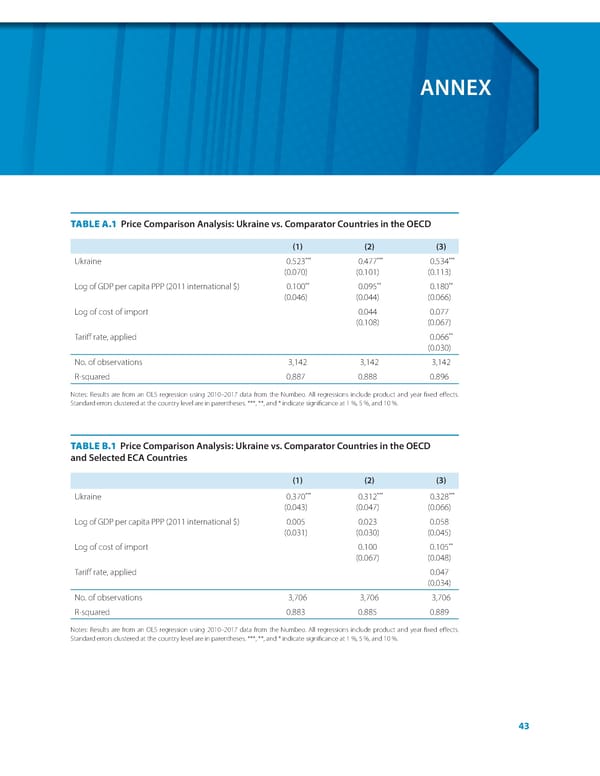
ANNEX TABLE A.1 Price Comparison Analysis: Ukraine vs ⸀ Comparator Countries in the OECD (1) (2) (3) Ukraine 0.523*** 0.477*** 0.534*** (0.070) (0.101) (0.113) Log of GDP per capita PPP (2011 international $) 0.100** 0.095** 0.180** (0.046) (0.044) (0.066) Log of cost of import 0.044 0.077 (0.108) (0.067) Tari昀昀 rate, applied 0.066** (0.030) No. of observations 3,142 3,142 3,142 R-squared 0.887 0.888 0.896 Notes: Results are from an OLS regression using 2010–2017 data from the Numbeo. All regressions include product and year 昀椀xed e昀昀ects. Standard errors clustered at the country level are in parentheses. ***, **, and * indicate signi昀椀cance at 1 %, 5 %, and 10 %. TABLE B.1 Price Comparison Analysis: Ukraine vs ⸀ Comparator Countries in the OECD and Selected ECA Countries (1) (2) (3) Ukraine 0.370*** 0.312*** 0.328*** (0.043) (0.047) (0.066) Log of GDP per capita PPP (2011 international $) 0.005 0.023 0.058 (0.031) (0.030) (0.045) Log of cost of import 0.100 0.105** (0.067) (0.048) Tari昀昀 rate, applied 0.047 (0.034) No. of observations 3,706 3,706 3,706 R-squared 0.883 0.885 0.889 Notes: Results are from an OLS regression using 2010–2017 data from the Numbeo. All regressions include product and year 昀椀xed e昀昀ects. Standard errors clustered at the country level are in parentheses. ***, **, and * indicate signi昀椀cance at 1 %, 5 %, and 10 %. 43
 World Bank Document Page 50 Page 52