
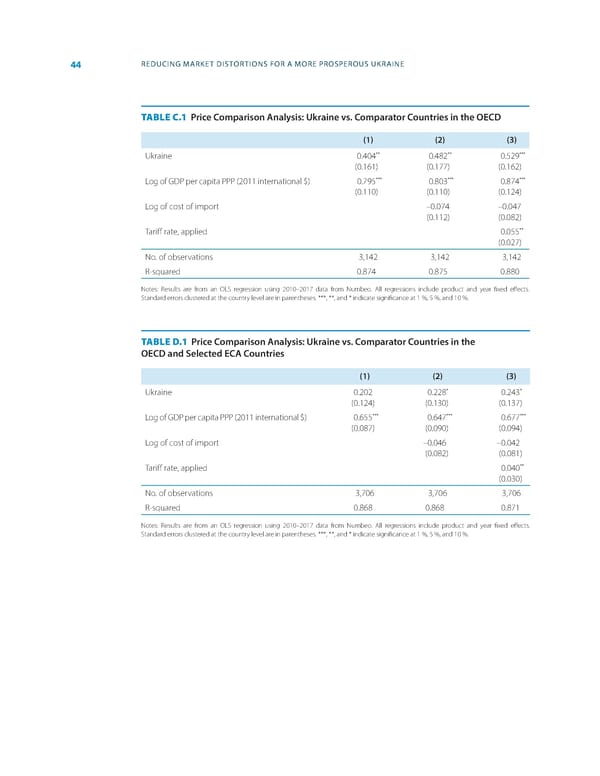
44 REDUCING MARKET DISTORTIONS FOR A MORE PROSPEROUS UKRAINE TABLE C.1 Price Comparison Analysis: Ukraine vs ⸀ Comparator Countries in the OECD (1) (2) (3) Ukraine 0.404** 0.482** 0.529*** (0.161) (0.177) (0.162) *** *** *** Log of GDP per capita PPP (2011 international $) 0.795 0.803 0.874 (0.110) (0.110) (0.124) Log of cost of import –0.074 –0.047 (0.112) (0.082) ** Tari昀昀 rate, applied 0.055 (0.027) No. of observations 3,142 3,142 3,142 R-squared 0.874 0.875 0.880 Notes: Results are from an OLS regression using 2010–2017 data from Numbeo. All regressions include product and year 昀椀xed e昀昀ects. Standard errors clustered at the country level are in parentheses. ***, **, and * indicate signi昀椀cance at 1 %, 5 %, and 10 %. TABLE D.1 Price Comparison Analysis: Ukraine vs ⸀ Comparator Countries in the OECD and Selected ECA Countries (1) (2) (3) * * Ukraine 0.202 0.228 0.243 (0.124) (0.130) (0.137) *** *** *** Log of GDP per capita PPP (2011 international $) 0.655 0.647 0.677 (0.087) (0.090) (0.094) Log of cost of import –0.046 –0.042 (0.082) (0.081) ** Tari昀昀 rate, applied 0.040 (0.030) No. of observations 3,706 3,706 3,706 R-squared 0.868 0.868 0.871 Notes: Results are from an OLS regression using 2010–2017 data from Numbeo. All regressions include product and year 昀椀xed e昀昀ects. Standard errors clustered at the country level are in parentheses. ***, **, and * indicate signi昀椀cance at 1 %, 5 %, and 10 %.
 World Bank Document Page 51 Page 53