
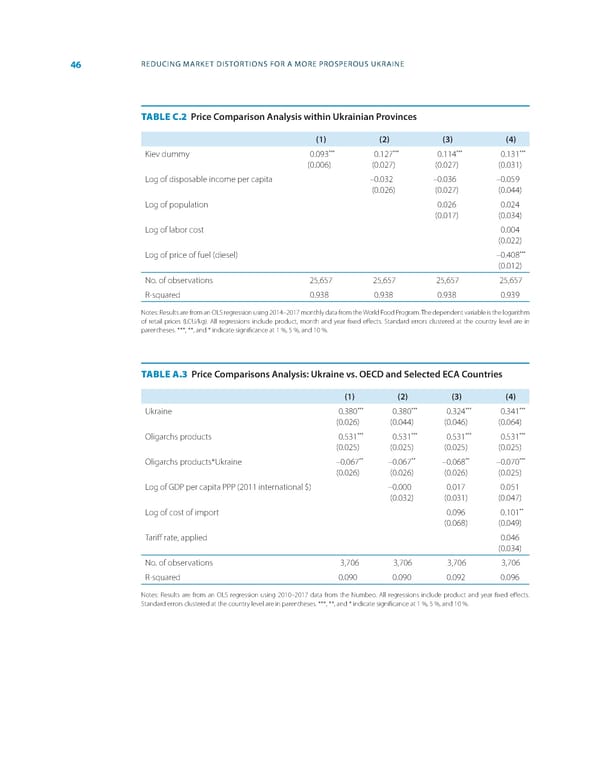
46 REDUCING MARKET DISTORTIONS FOR A MORE PROSPEROUS UKRAINE TABLE C.2 Price Comparison Analysis within Ukrainian Provinces (1) (2) (3) (4) *** *** *** *** Kiev dummy 0.093 0.127 0.114 0.131 (0.006) (0.027) (0.027) (0.031) Log of disposable income per capita –0.032 –0.036 –0.059 (0.026) (0.027) (0.044) Log of population 0.026 0.024 (0.017) (0.034) Log of labor cost 0.004 (0.022) *** Log of price of fuel (diesel) –0.408 (0.012) No. of observations 25,657 25,657 25,657 25,657 R-squared 0.938 0.938 0.938 0.939 Notes: Results are from an OLS regression using 2014–2017 monthly data from the World Food Program. The dependent variable is the logarithm of retail prices (LCU/kg). All regressions include product, month and year 昀椀xed e昀昀ects. Standard errors clustered at the country level are in parentheses. ***, **, and * indicate signi昀椀cance at 1 %, 5 %, and 10 %. TABLE A.3 Price Comparisons Analysis: Ukraine vs ⸀ OECD and Selected ECA Countries (1) (2) (3) (4) *** *** *** *** Ukraine 0.380 0.380 0.324 0.341 (0.026) (0.044) (0.046) (0.064) *** *** *** *** Oligarchs products 0.531 0.531 0.531 0.531 (0.025) (0.025) (0.025) (0.025) ** ** ** *** Oligarchs products*Ukraine –0.067 –0.067 –0.068 –0.070 (0.026) (0.026) (0.026) (0.025) Log of GDP per capita PPP (2011 international $) –0.000 0.017 0.051 (0.032) (0.031) (0.047) Log of cost of import 0.096 0.101** (0.068) (0.049) Tari昀昀 rate, applied 0.046 (0.034) No. of observations 3,706 3,706 3,706 3,706 R-squared 0.090 0.090 0.092 0.096 Notes: Results are from an OLS regression using 2010–2017 data from the Numbeo. All regressions include product and year 昀椀xed e昀昀ects. Standard errors clustered at the country level are in parentheses. ***, **, and * indicate signi昀椀cance at 1 %, 5 %, and 10 %.
 World Bank Document Page 53 Page 55