
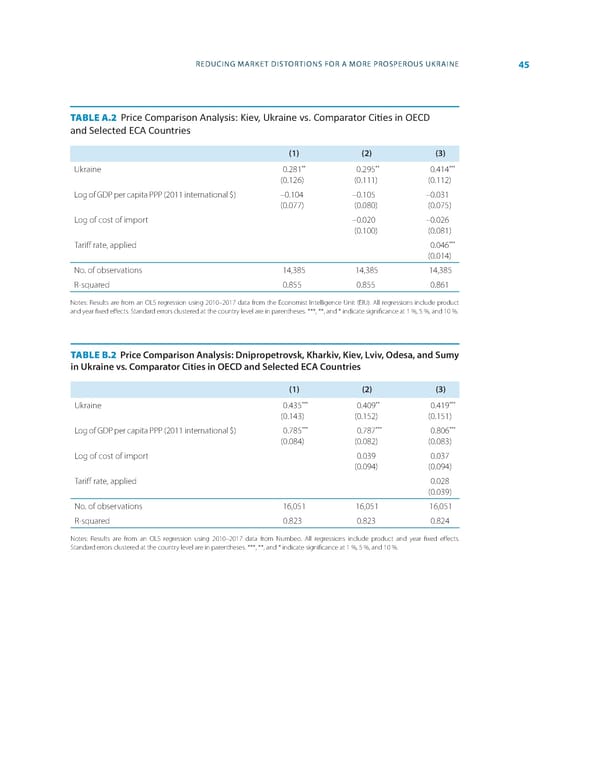
REDUCING MARKET DISTORTIONS FOR A MORE PROSPEROUS UKRAINE 45 TABLE A.2 Price Comparison Analysis: Kiev, Ukraine vs. Comparator Ci琀椀es in OECD and Selected ECA Countries (1) (2) (3) ** ** *** Ukraine 0.281 0.295 0.414 (0.126) (0.111) (0.112) Log of GDP per capita PPP (2011 international $) –0.104 –0.105 –0.031 (0.077) (0.080) (0.075) Log of cost of import –0.020 –0.026 (0.100) (0.081) *** Tari昀昀 rate, applied 0.046 (0.014) No. of observations 14,385 14,385 14,385 R-squared 0.855 0.855 0.861 Notes: Results are from an OLS regression using 2010–2017 data from the Economist Intelligence Unit (EIU). All regressions include product and year 昀椀xed e昀昀ects. Standard errors clustered at the country level are in parentheses. ***, **, and * indicate signi昀椀cance at 1 %, 5 %, and 10 %. TABLE B.2 Price Comparison Analysis: Dnipropetrovsk, Kharkiv, Kiev, Lviv, Odesa, and Sumy in Ukraine vs ⸀ Comparator Cities in OECD and Selected ECA Countries (1) (2) (3) *** ** *** Ukraine 0.435 0.409 0.419 (0.143) (0.152) (0.151) *** *** *** Log of GDP per capita PPP (2011 international $) 0.785 0.787 0.806 (0.084) (0.082) (0.083) Log of cost of import 0.039 0.037 (0.094) (0.094) Tari昀昀 rate, applied 0.028 (0.039) No. of observations 16,051 16,051 16,051 R-squared 0.823 0.823 0.824 Notes: Results are from an OLS regression using 2010–2017 data from Numbeo. All regressions include product and year 昀椀xed e昀昀ects. Standard errors clustered at the country level are in parentheses. ***, **, and * indicate signi昀椀cance at 1 %, 5 %, and 10 %.
 World Bank Document Page 52 Page 54